In the pipeline industry, there is a growing requirement for independent vibration risk reduction design assessments, both for new pipeline facilities and for modification projects.
The reason is simple: the most costly, time-consuming, complex, and reputation-damaging vibration problems are those caused by resonance.
When a machine or system’s natural frequency is excited (i.e., structural resonance), vibration levels can be amplified by a factor of ten or more. In severe cases, this can lead to equipment damage, unplanned outages, and even catastrophic failures. For a pipeline company, such failures can quickly escalate into a national news event, with significant operational, financial, and reputational consequences.
Problem Statement
- What: New pipeline stations with motor-driven pumps, with planned future increases in flow rate (Production - Barrels per Day).
- Why: The pipeline operator aims to reduce the risk of high-exposure vibration problems during commissioning and throughout the life of the asset.
- Biggest challenge: Wide variation in fluid properties (density, temperature) and ambient conditions causes acoustic and structural natural frequencies to shift. These shifts can coincide with running speed or vane pass frequency (VPF), leading to resonance.
Use a structural and acoustic design-assessment strategy with the following steps:
-
- Independent dynamic assessment. Specify a system-level evaluation using modern finite element analysis (FEA) methods.
- Clear acceptance criteria. Specify the maximum allowable vibration levels in accordance with API 610 and define the minimum natural frequency separation margins from expected excitation sources.
- Post-installation verification. Perform specialized vibration testing and collect both structural data (accelerometers and motion-magnification video) and acoustic data (dynamic pressure) at key locations in the piping and equipment.
- Data-driven actions. Use the recorded vibration data to:
- Confirm overall vibration levels and natural frequency separation margins meet the specified criteria.
- Identify and correct any remaining issues efficiently.
- Trend vibration metrics for predictive maintenance.
- Calibrate and update the Step 1 FEA models to continuously improve future station assessments.
A key point – in general structural and acoustic natural frequencies are dependent on the entire as-assembled system including the soil, foundation, machinery in the system, connected piping, pipe supports, ambient conditions, performance requirements, and fluid characteristics. This one-page pdf document
explains important terms, such as, natural frequency, resonance, amplification factor, and separation margin.
Work Performed
Methods:
- Design assessment - Using the combined experience of the pipeline company and MSI, along with FEA for structural and acoustic analysis. Define likely excitation sources, boundary conditions, and target separation margins.
- Post- installation testingby MSI - Condition Monitoring, Experimental Modal Analysis (EMA or “Impact” test), Operating Deflection Shape (ODS), and Motion Magnified Video.
 Figure 1. In this example, the FEA model used for the structural analysis of the entire station (over 1 million nodes) was first constructed, then the sections of the model were analyzed separately (see Figures 3 to 7).
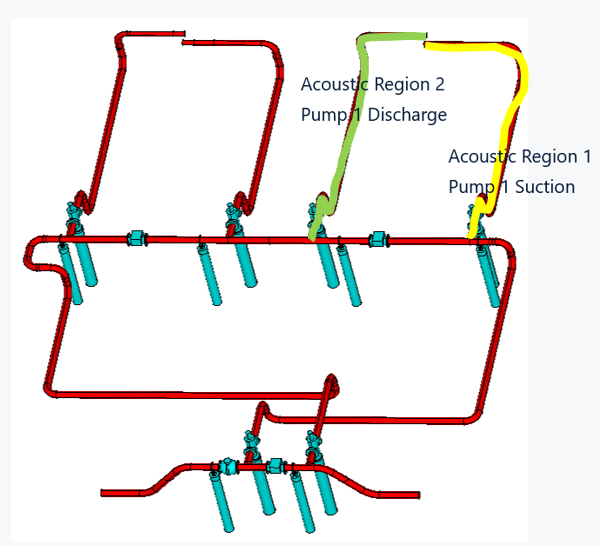
Figure 2. The model used for the acoustic analysis assumes closed boundary conditions at both the impeller and at the first tee junction to capture the full acoustic reflection. Longer length acoustic models extended from the pump to the force main tee junction.
 |

|
Figure 3. The overall FEA model shown in Figure 1 was separated into four regions. Upper left - Region 1 was the suction piping model. Upper Right – An example FEA solution showing the piping lateral mode shape for Region 1 estimated at 84.0 Hertz (5037 rpm) – well away from typical excitation sources, especially pump running speed. The still image (left) of the FEA animation shows the amount of lateral motion/vibration IF the mode were to be excited.
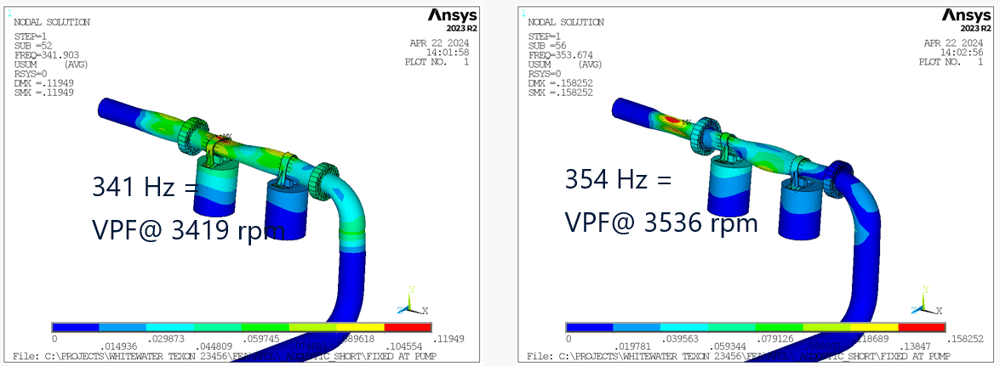
Figure 4. Multiple pipe bell-type (ovalizing) modes were predicted that could be excited by vane pass frequency (VPF) in the running speed range of 2500rpm to 3600 rpm. MSI provided solution recommendations IF post-installation testing identified a specific problem mode.
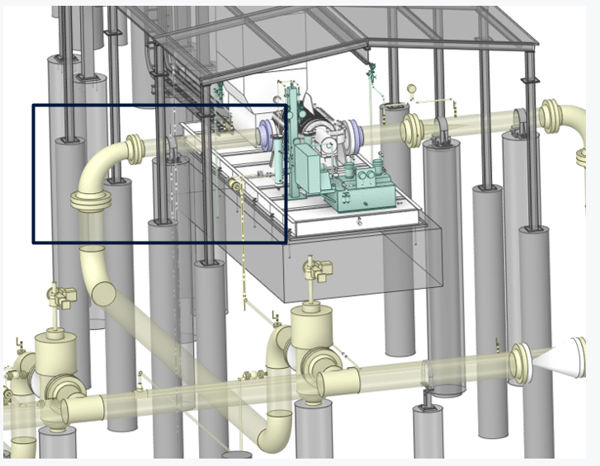
Figure 5. Region 2 discharge piping portion of the FEA model.

|

|
Figure 6. The overall FEA model shown in Figure 1 was separated into four regions. Left - Region 3 was the central manifold and valve region. Right - The FEA model solution showing one of several central valve section modes near the full pump speed of 3600rpm (60 Hertz).

|

|
Figure 7. Left – Region 4 was the above-ground valves and force main connection. Right - The FEA model solution showing one of several modes for Region 4 near the vane pass frequency (6xN) at full pump speed. MSI predicted that these modes would not be excited due to the spacing between the pumps and force main connection (Spoiler Alert – Post installation testing confirmed this prediction).
- Assessment Findings (Structural):
- Good news - No structural pipe modes were identified in any of the four regions that could be excited by pump rotor imbalance at 1×N.
- Cautionary news - Multiple suction and discharge piping bell modes (pipe ovalizing) were predicted to align with the vane pass frequency (6×N). MSI recommended addressing this potential issue during post-installation testing.
- Informative - Structural natural frequencies are not expected to vary with running speed. However, changes in pumped-fluid density can shift these modes by approximately ±5%.
- Note – An unsteady Computational Fluid Dynamics (CFD) analysis of the central manifold region was not performed. This optional analysis is used to evaluate whether flow instabilities (e.g., vortex shedding) could excite structural pipe modes, with particular attention to flow past branch lines and dead legs.
- Assessment Findings (Acoustic)
- Challenging - Acoustic natural frequencies are closely spaced, particularly from the pump discharge to the first tee. Given this spacing and the large variation in the speed of sound of the pumped fluids, complete avoidance of interaction with acoustic modes is not feasible. This is typical for pipeline pump systems.
- Informative - Variations in the speed of sound in the pumped fluid were found to shift the acoustic modes by approximately 20%.
- Caution - Bell modes are most sensitive to acoustic excitation when cross-sectional pressure reversals occur. This cross-sectional acoustic behavior was not indicated by the FEA; dynamic pressure transducers used during post-installation testing were applied to confirm the absence of such modes.
- Recommended Action - Evaluate small-bore piping (instrument taps, drains, vents, relief lines) based on the final as-built geometry and be prepared to address potential issues during post-installation testing.
- Post-Installation Testing Findings
- Good news with a caution - Overall Vibration Amplitude
- The maximum overall vibration amplitudes of the pump, motor, main piping, and associated small-bore piping (SBP) were low and within acceptance criteria.
- Good news with a caution - Overall Vibration Amplitude
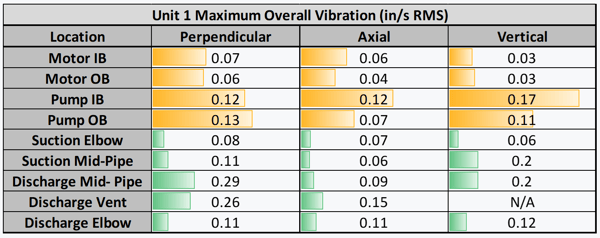
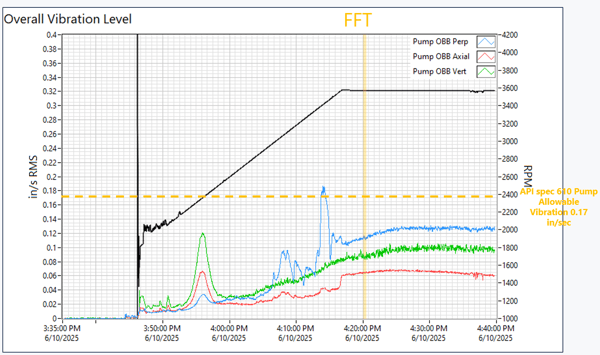
Figure 8. Top - Reporting format for summarizing important overall vibration measurements near the pump and motor. Bottom – Example of how overall vibration data details are reported for one measurement location (pump outboard bearing housing) in three directions.
-
The discharge elbow vent port and bypass lines on the station loop exhibited slightly elevated vibration, but discrete component amplitudes remained within acceptable limits.
 Figure 9. Station Loop and Isolation value overall vibration summarizing reporting format. Points in red highlight the highest discrete vibration measurements. All measurements are within allowable values (see Figure 10) at the current operating conditions but will likely need attention if the pump station flow capacity is increased.
-
-
- The pipeline section at the inlet vent ports and suction MOV bypass lines showed higher vibration levels, with values still within specified limits.
-
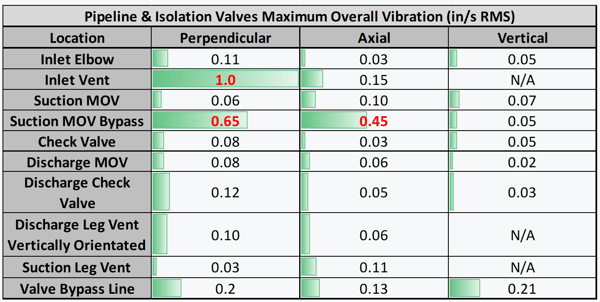
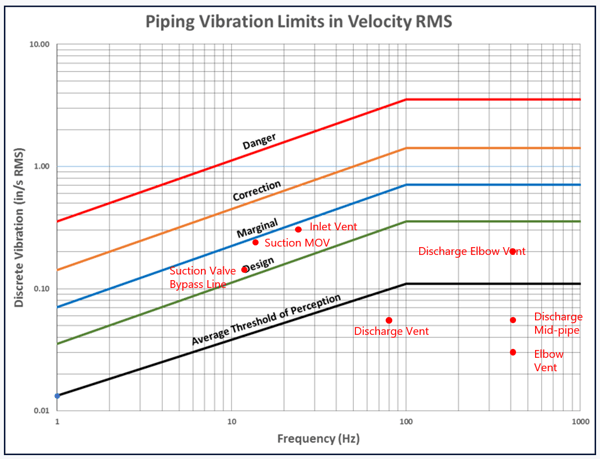
Figure 10. The highest discrete piping vibration is within the specified values at the current full flow rate operating conditions. While no immediate failure is expected, MSI recommended reinforcing the SBP to reduce fatigue risk if the flow rates are increased in the future.
-
-
- While no immediate failure is expected, if the station owner plans to increase future flow rates, reinforcing the SBP is recommended to reduce fatigue risk.
-
Figure 11. ODS animation at vane pass frequency showing motion for several small-bore pipes (SBP). The motion is to scale and exaggerated. While no immediate failure is expected, MSI provided details for reinforcing the SBP to reduce fatigue risk if flow rates are increased in the future
-
- Recommended future Actions – Examples of recommendations provided by MSI to improve long-term reliability ahead of potential future flow-rate increases:
- Restraining the suction MOV bypass piping (ODS animation in Figure 12) on the station loop and pipeline using concrete piers, positioned to prevent excitation of the observed “W-shape” mode.
- Recommended future Actions – Examples of recommendations provided by MSI to improve long-term reliability ahead of potential future flow-rate increases:
Figure 12. An ODS animation of the pipeline loop view when operating at 58 Hertz (near maximum running speed). This mode should not become an issue unless the pipeline flow capacity is increased in the future. MSI provided a support modification recommendation for possible future use.
-
-
- Replacing vertical pipe supports with horizontal restraints on the above-ground sections of piping connected to the inlet and outlet pressure transmitter valves, which exhibited elevated motion, to increase lateral stiffness and reduce vibration.
- These design and re-design strategies have proven successful in prior projects
-
- Informative - Dynamic pressure measurements were within expected norms (Figure 13). Even nominal VPF dynamic pressure can excite structural or acoustic natural frequencies if damping is low.
Please contact MSIif you're interested in learning more about vibration risk reduction. MSI can provide sample specifications upon request.
